




Two weeks before an election, a single survey lands showing one candidate ahead by six points. The previous poll had them behind by two. Supporters share it widely; opponents pick it apart. Twenty-four hours later, another poll appears with a different story. Anyone following the coverage closely enough will feel the ground shifting several times a day.
Most of that motion is noise. A polling average, read properly, is one of the more reliable instruments available to a voter who wants to know roughly where a race stands — not because polls are perfect, but because averaging them smooths out the errors that a single survey exaggerates. What follows is a working guide to reading those numbers without getting whiplash.
What a polling average actually is
A polling average is a weighted combination of recent surveys in a given race. It is not a poll itself, and it is not a forecast. Good aggregators typically favour newer polls over older ones, give more weight to pollsters with a track record, and often adjust for known tendencies of individual firms — a method usually called house effects. Some also correct for partisan lean depending on who commissioned the survey.
The result is a number that answers a modest question: if you had to guess where the race stands right now, based on the best available evidence, what would you say? It does not tell you who will win. It tells you what the evidence currently suggests about the state of play, and it moves as new evidence arrives.
That distinction matters more than most readers realise. A candidate leading an average by three points with three weeks to go is not "winning." They are ahead at a moment when a great deal can still change, and when the average itself carries an uncertainty band wider than that three-point gap.
Margins of error, and what they don't mean
The margin of error on a typical national poll is often around three or four points, and readers routinely misread it. It is not a boundary outside which the poll is simply wrong, and it is not a rule that the lead must be larger than the margin to be "real" — though that is a useful rule of thumb for a single survey.
The margin of error describes sampling uncertainty: the range within which the true figure would likely fall if the same question were asked of the whole population, assuming the sample was drawn randomly and everyone answered honestly. It does not cover the many other things that can go wrong — how the sample was weighted, who was reachable, who chose to respond, and how likely each respondent is to actually turn out.
So a poll showing 47 to 44 with a three-point margin is not evidence of a stable three-point lead. It is evidence of a close race, possibly a tie, possibly a slightly wider gap. When you see a headline built on a lead smaller than the margin of error, treat the direction — not the distance — as the finding.
Averages shrink the error, but don't erase it
Combining many polls narrows sampling error, but it does not remove systematic error. If the same flawed assumption — say, about which voters will show up — runs through every survey in the average, averaging will not fix it. This is why averages can still miss badly even when the individual polls were conducted competently. Treat the average as a strong estimate, not a verdict.
Sample size: less important than you might think
People dismiss a poll of 800 voters as "too small" and trust one of 5,000. The difference in sampling precision between those sizes is smaller than it feels. Once a properly drawn sample reaches the high hundreds, additional respondents buy diminishing accuracy. A well-weighted sample of 1,000 can be more informative than a poorly constructed sample of 20,000.
The more useful questions about a poll are: who was sampled, how were they contacted, and how were the results weighted? A survey taken entirely online among people who volunteered for a panel is a different instrument from one that reaches voters by phone at random. Both can be valid; they carry different risks.
Reading the trend line instead of the single survey
The single most useful habit in polling is to look at the shape of the line, not the last dot on it. Ask a simple question: over the last month, has the average moved in a consistent direction, or is it bouncing around within a range? If a candidate has floated between 44 and 47 per cent for six weeks, a new poll at 49 is probably a blip. If the average has climbed steadily from 42 to 47 across a dozen surveys, that is a genuine shift worth paying attention to.
Practical signals that a change is real:
- The movement appears in several polls from different firms, not one outlier.
- It persists across two or three weeks rather than a single news cycle.
- It shows up in the average, not just in one pollster's series.
- It is accompanied by a plausible explanation, such as a debate, a scandal, a major economic shift or a change in the candidate field.
- It appears in other measures too — the other candidate's numbers, undecided share, or state-level races.
Conversely, a dramatic single poll immediately after a big news event often captures a temporary reaction. Give it time. If the shift is real, the next few surveys will confirm it.
House effects, herding and the quality question
Different pollsters consistently produce slightly different numbers, even when surveying the same race at the same time. Some of this is methodology; some is weighting choices; some is deliberate. Firms that want to look accurate sometimes cluster around the consensus, producing results suspiciously similar to the average. That herding makes an average look more certain than the underlying evidence warrants.
You do not need to become an expert in pollster ratings to navigate this. It helps to know which firms are transparent about their methods, whether a poll was commissioned by a campaign or a party, and whether the average you are reading already accounts for those factors. A poll released by a campaign is not necessarily wrong, but it was produced by someone with a stake in the result.
Watch the undecideds and the turnout question
Two numbers sit quietly beside the headline. The share of undecided or third-party voters tells you how much room remains for movement. And the expected turnout model — who the pollster assumes will actually vote — can shift results by several points. In low-turnout elections, small differences in assumptions matter a lot. When you see a race described as "tightening," check whether the vote share moved or whether the turnout model did.
A simple routine to use before election day
Pick one reputable polling average per race and stick with it. Check it once a day at most, ideally once a week. When a new poll makes headlines, look at whether the average moved, and by how much — usually the answer is very little.
Before you repeat a number, ask three questions: Is this a single poll or an average? How old is the data? And is the gap larger than the uncertainty around it? If the answer to the last is no, describe the race as close, not as leaning.
Finally, hold the numbers loosely. Polling averages are the best tool available for understanding where a race stands, and they are still an estimate of a moving thing. A lead of two or three points a week out is not a prediction of anything — it is a description of a competitive contest with the outcome genuinely open. Read them for the trend, use them to calibrate your expectations, and remember that the only poll that counts is the one nobody needs to average.
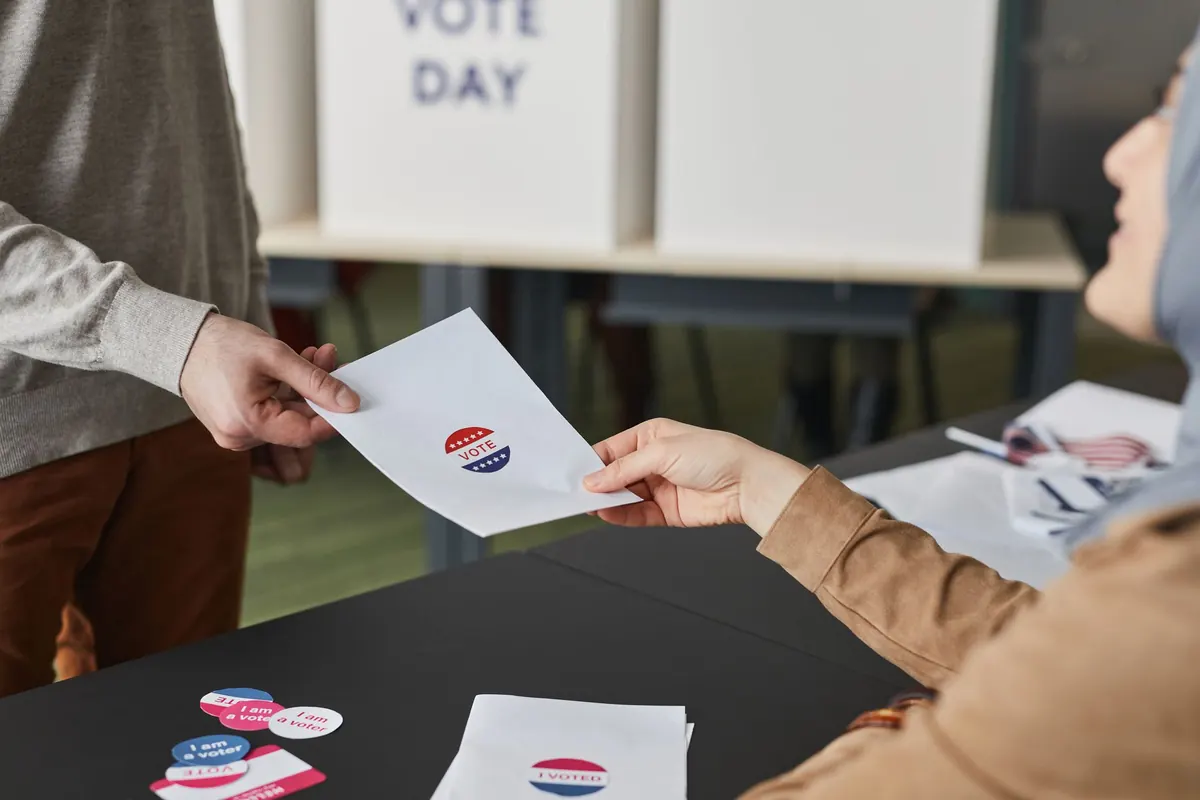
Photo: Edmond Dantès / Pexels